Grafana
Visualisation and dashboards over Prometheus, Zabbix, databases and clouds.
open source hybrid
What it is
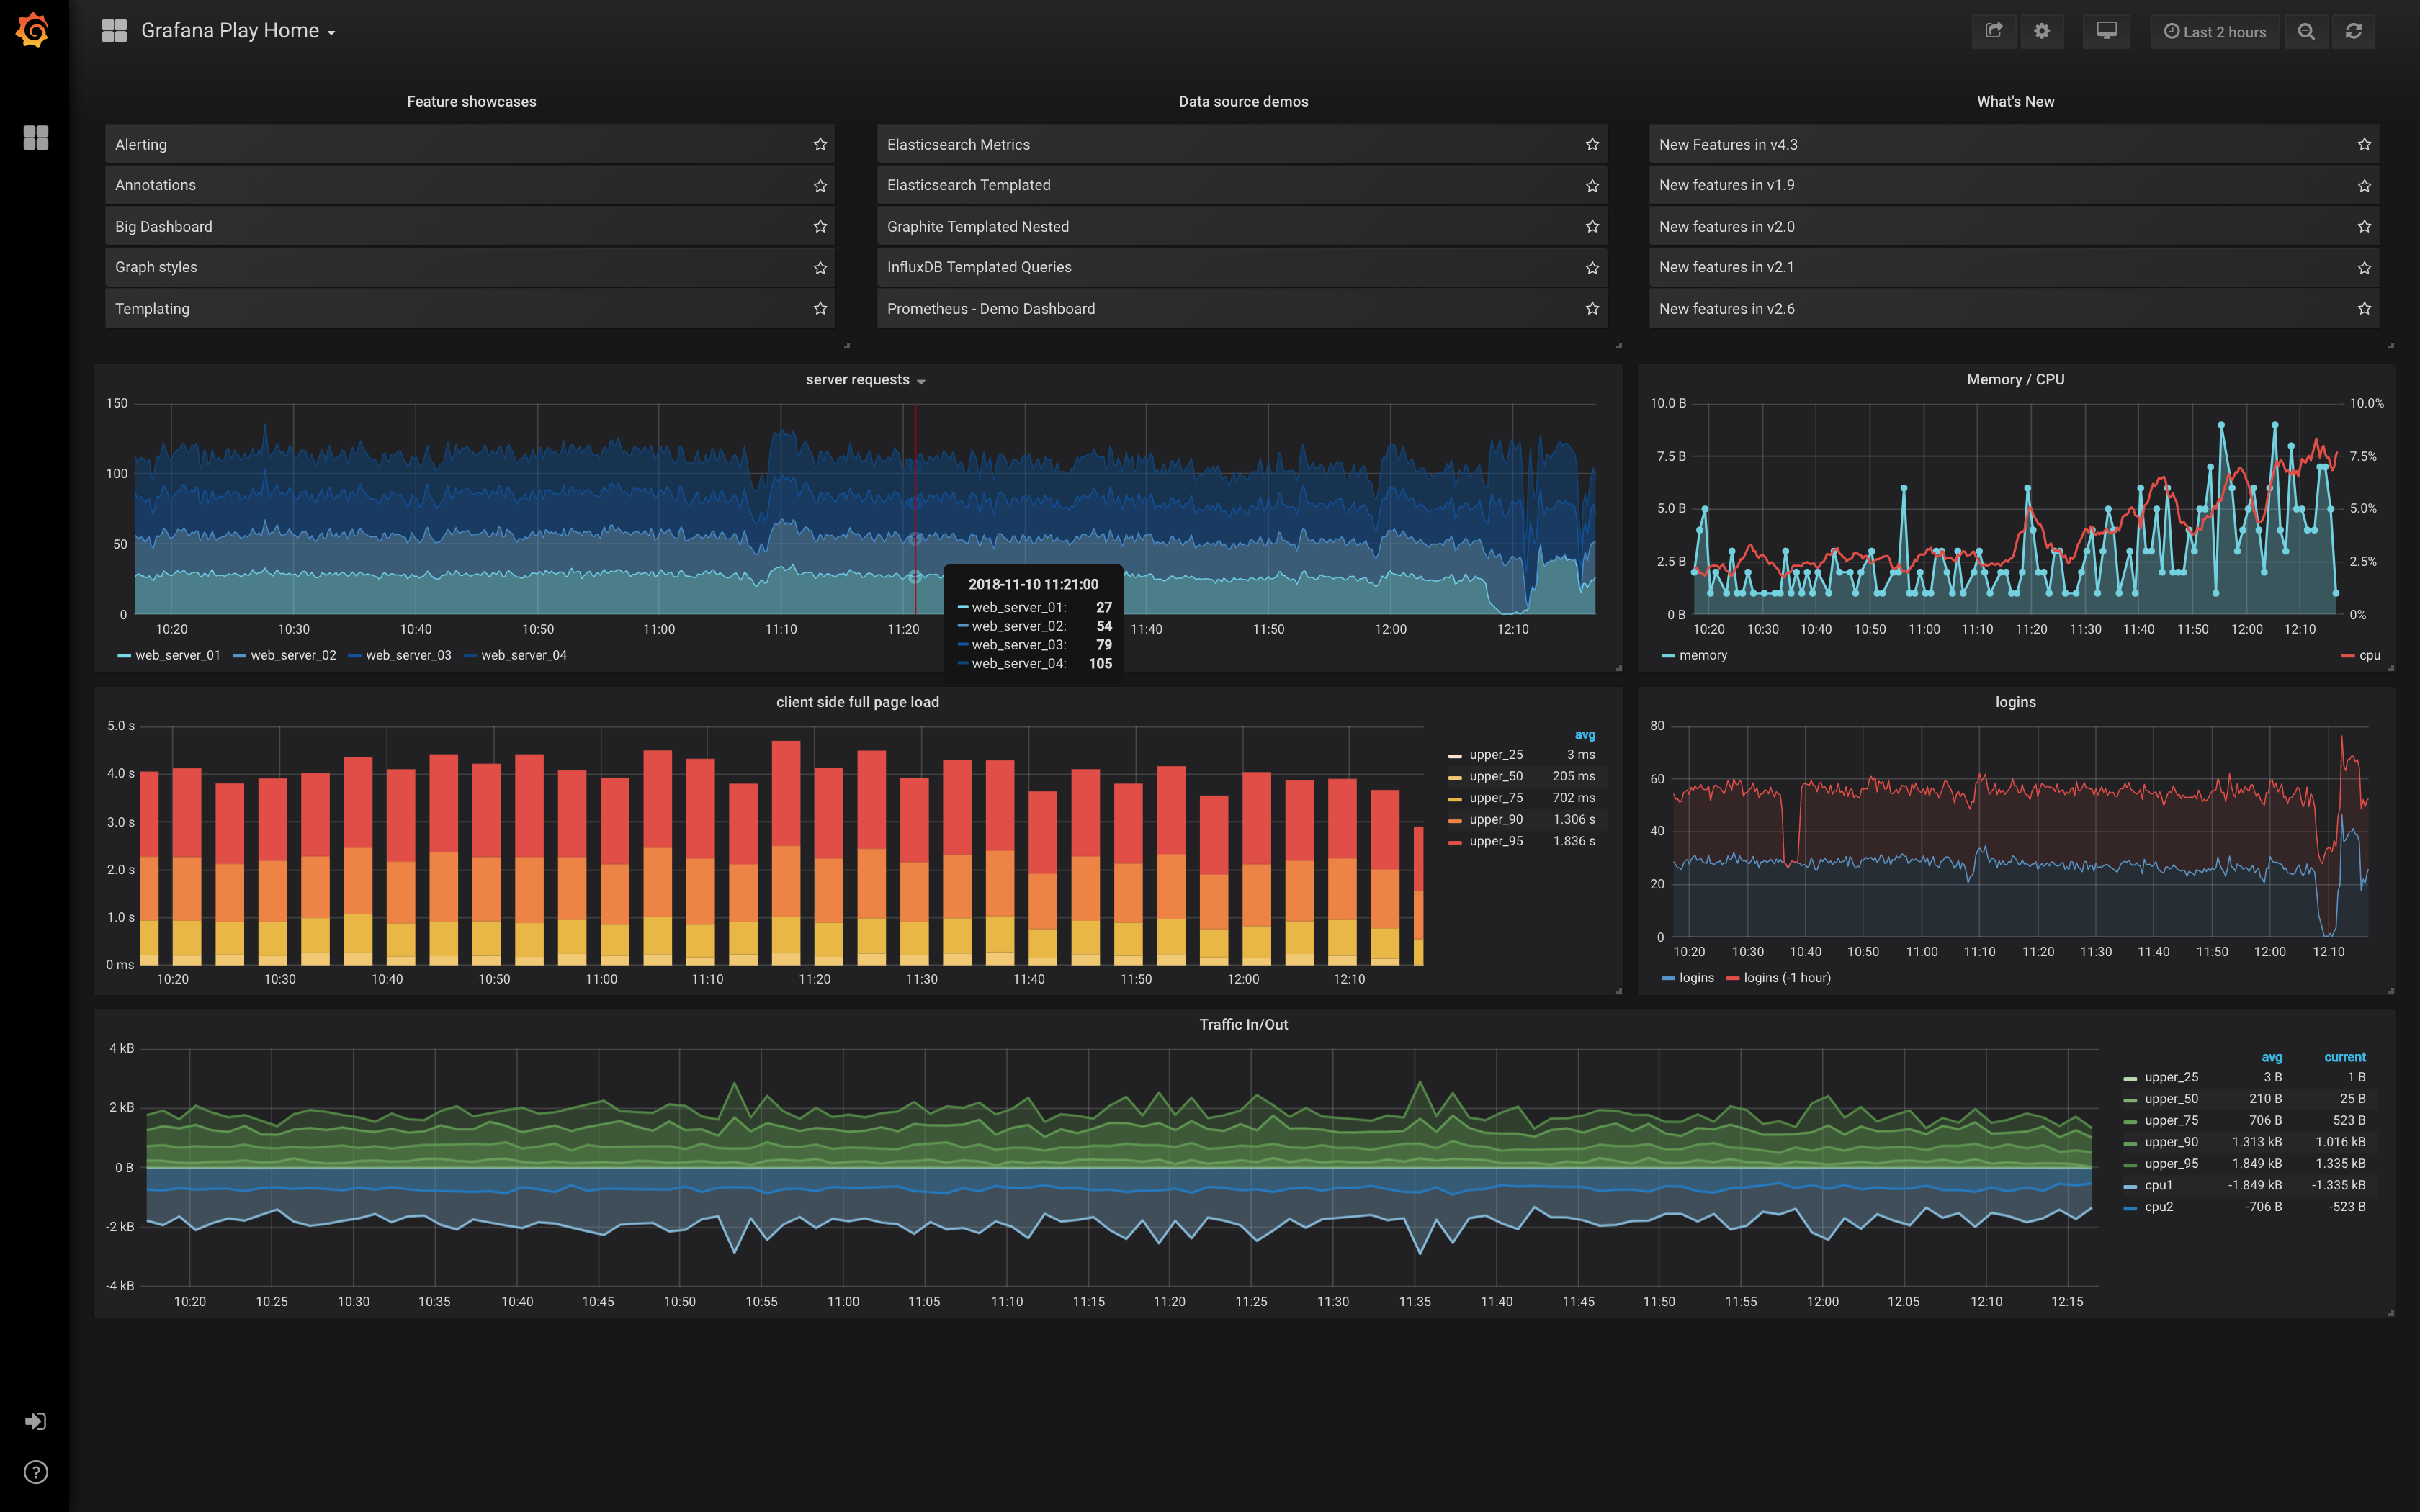
Grafana is a visualisation and analytics platform. It connects to Prometheus, Zabbix, databases and cloud providers and builds interactive dashboards and alerts, giving a single pane of glass over an infrastructure that other systems already measure.
Problems it solves
- Your metrics live in several systems and you want one dashboard over all of them.
- Teams need self-service dashboards without touching the data sources.
How administrators use it
- Add Prometheus and Zabbix as data sources and build shared dashboards.
- Define alert rules and route them to on-call channels.
Strengths & trade-offs
Strengths
- Connects to almost any data source.
- Excellent dashboards.
- OSS plus managed cloud.
Trade-offs
- It visualises, it does not collect — you still need a metrics backend.
- Alerting setup has a learning curve.
Questions
Does Grafana store metrics itself?
No — it visualises data from backends like Prometheus or Zabbix; you still need a data source.
Is Grafana free?
The open-source edition is free; Grafana Cloud has a free tier plus paid plans.
Alternatives
Prometheus
Time-series monitoring and alerting, the de-facto standard for cloud-native systems.
open source desktop download
Zabbix Open-source monitoring for servers, network gear, VMs and applications.
open source desktop download
Datadog Cloud observability — metrics, traces and logs — with no monitoring servers to run.
paid · trial SaaS · ad-safe